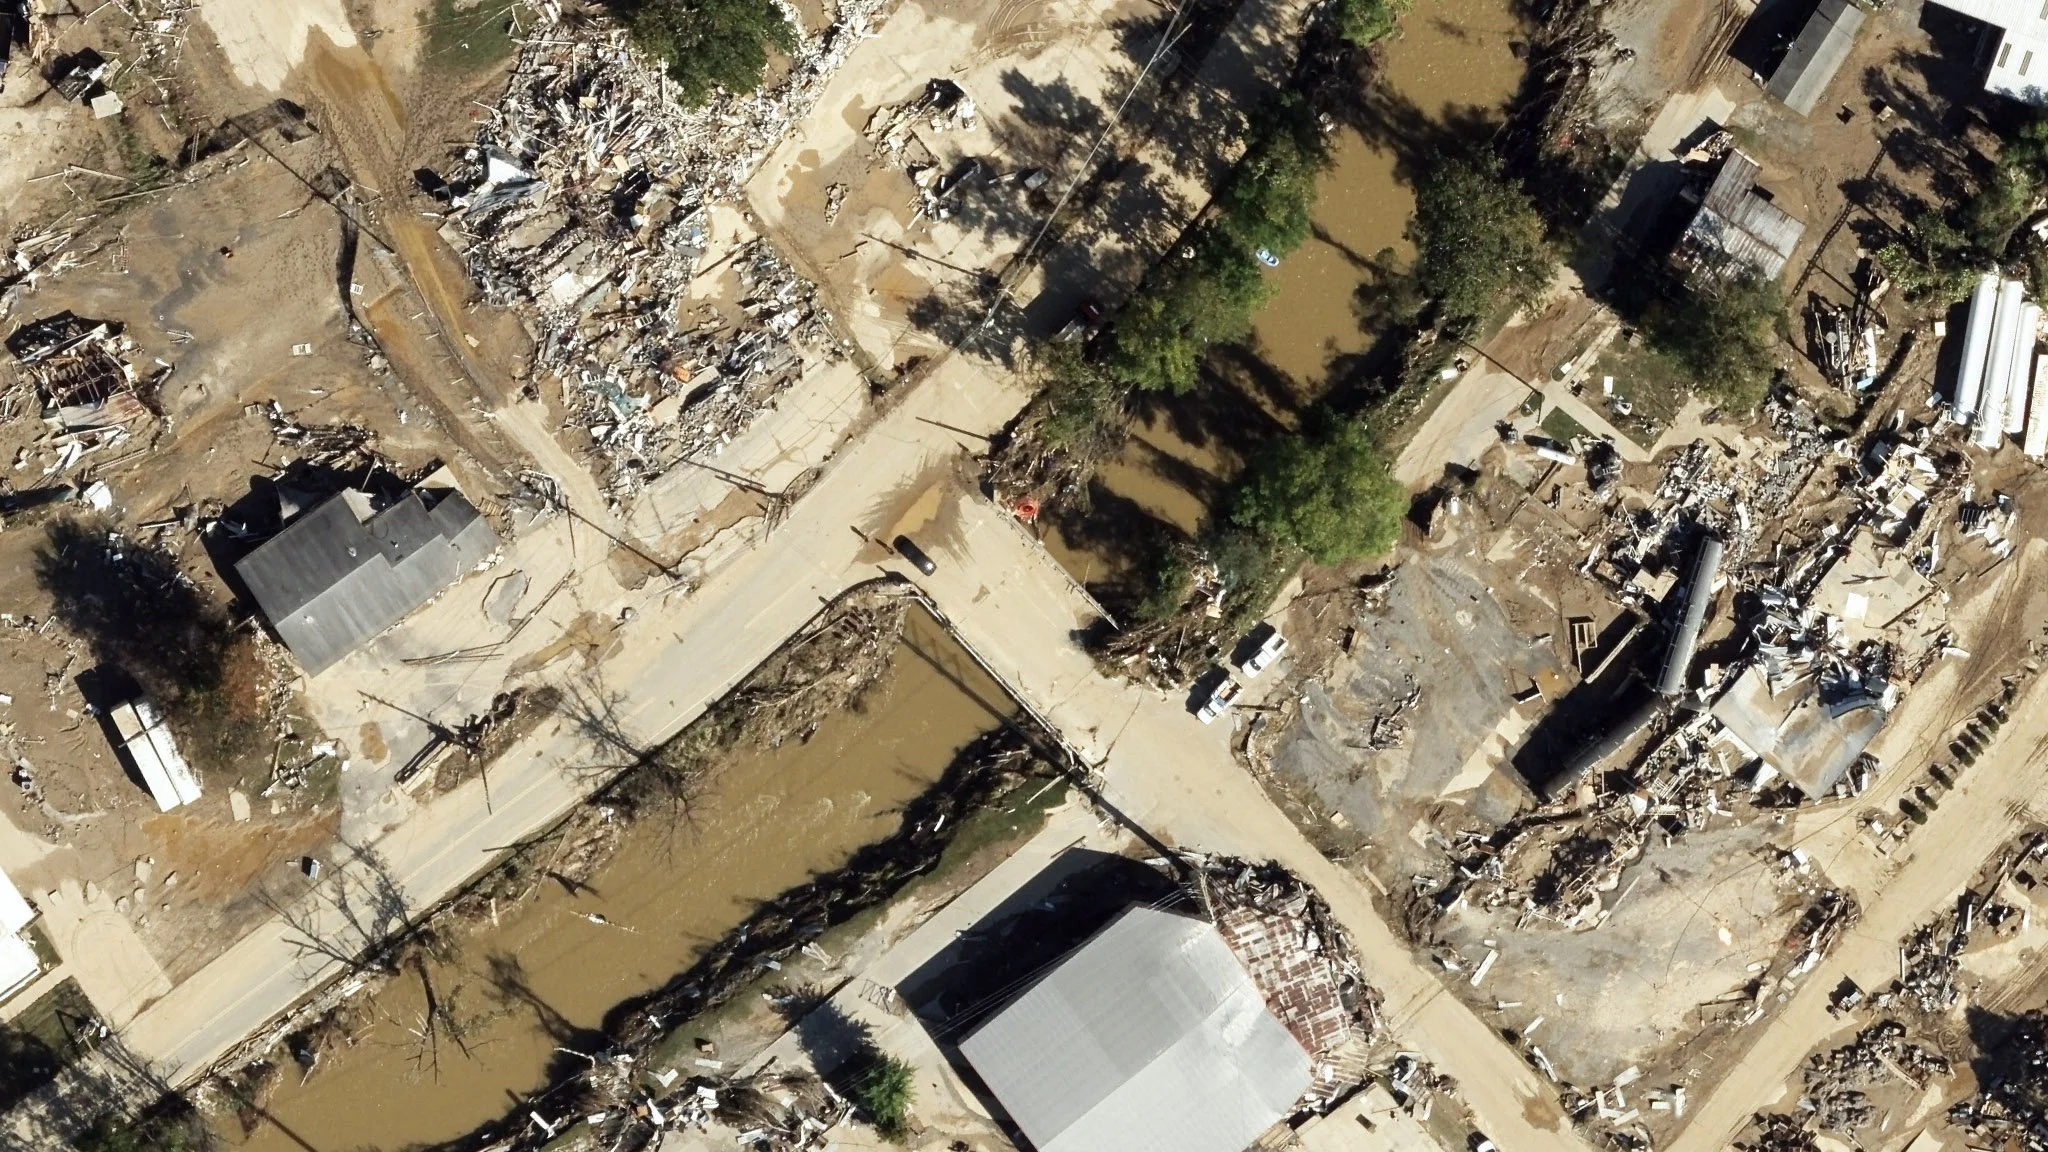
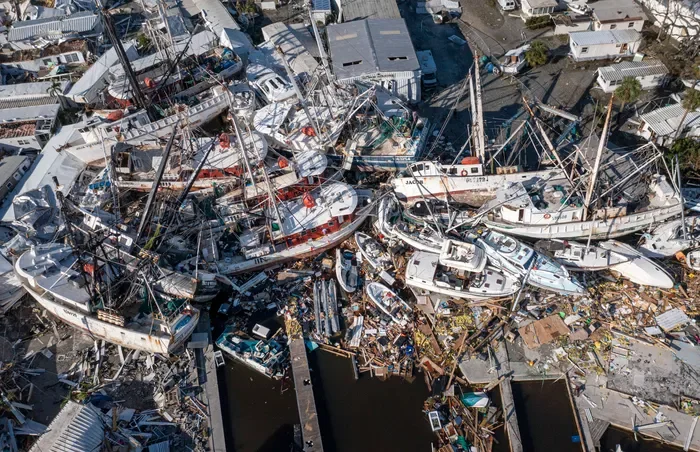
Hermes (AI Damage Mapping)
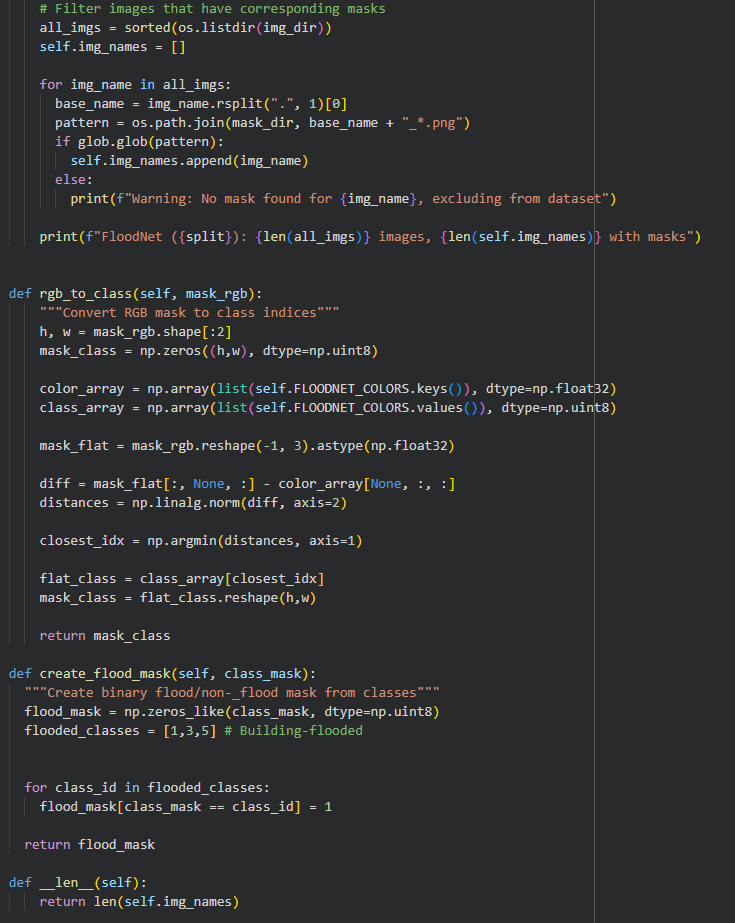
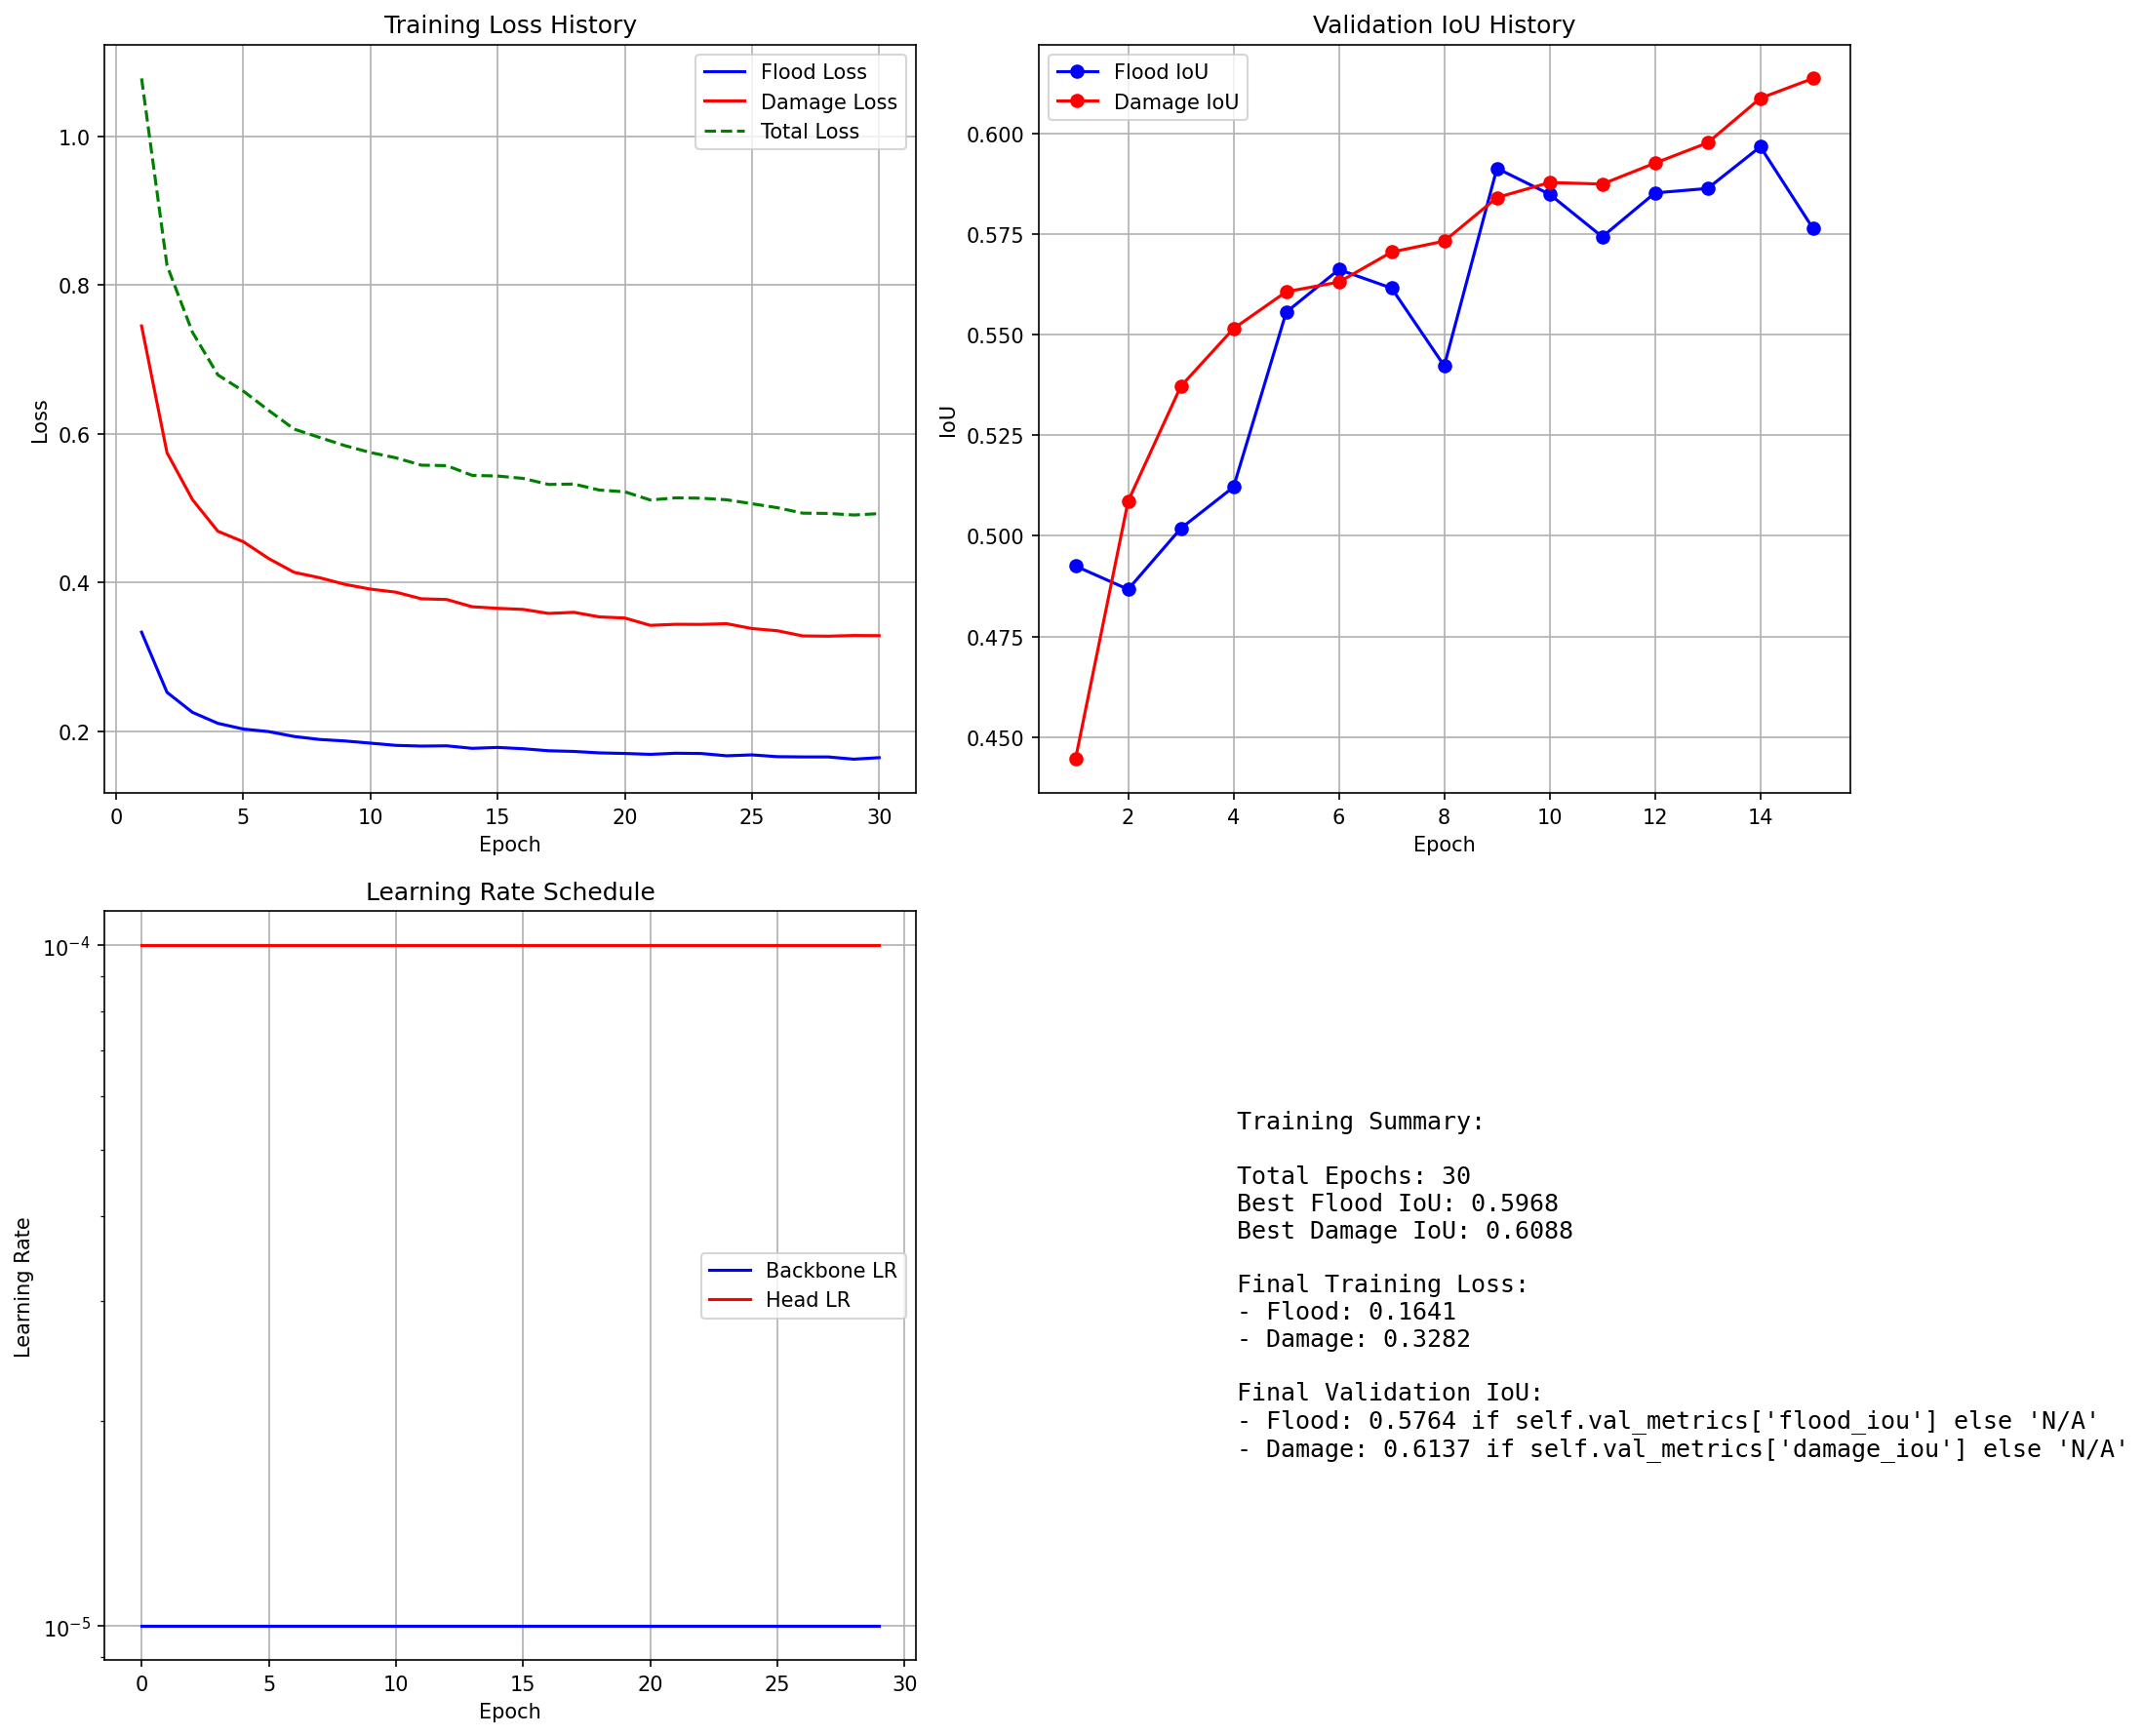
Hermes is a post-disaster “eyes + brain” stack: drones/satellite imagery in, GIS-ready damage layers out. The goal is simple turn messy aerial visuals into consistent, machine-readable flags (flooding, impacted buildings, blocked routes, etc.) so response teams can triage faster, safer, and with less guesswork. It does not propose a new model architecture. Instead It’s built as a practical CV pipeline (PyTorch + augmentations + segmentation baselines) the synthesize existing domain specific work within the UAV research community that we will iterate in the open and harden into something fieldable. Our current working model at version 0.3.8.2! More in-depth information about this project is hosted on Github, please see below.
Our long-term delivery goals:
Rapid situational layers you can drop into maps/dashboards (not just pretty images)
Standardized first-pass damage signals to support triage + documentation workflows
A foundation for scalable damage analytics across events, not one-off “hand review”
Transition into a lightweight SaaS platform capable of delivering structured geospatial damage output from data independently collected by response teams and infrastructure stakeholders.
Hermes builds within a broader ecosystem of academic and open geospatial research, including:
UAV-based structural damage mapping
Fine-grained disaster imagery classification
Semantic segmentation in overhead imagery
Flood and building detection benchmarks
Models are trained and evaluated using publicly available disaster and aerial datasets released by universities, research labs, and open geospatial initiatives.
Research & Data Foundations
Event Monitoring Layer
Disaster analysis is cyclical
Events emerge → signals propagate → imagery becomes available → assessment begins
To support that loop, Hermes will include a structured event-monitoring layer, as seen on our homepage. This system collects hazard-focused updates from curated public sources at defined intervals, deduplicates entries, and tags them with location and hazard metadata.
This creates a simple feedback loop:
Event Signal → Monitoring → Mapping Prioritization → Damage Layers
This monitoring will layer inform where and when mapping efforts should be directed, closing the gap between open-source signals and geospatial analysis.